
Why Infographics in 2026-27?
Infographic marketing offers vast potential for growing your modern audience, generating engagement, call to actions and learning content, enhancing brand recognition and improving both Ai and Search (Google) rankings.
Below I show 7 Steps to improve and streamline an infographic strategy so you leave nothing to the random.
#1: Reasearch and lock in your Audience Interests
If you’re looking to create an infographic that has audiences thinking, “Wow, that’s so cool! I have to share this!”, you need to evoke strong feelings. So before we even start, I’m going to ask you to do me a favor. Step out of the box. Right now. You can’t be in the box and create successful infographics.
If you think your industry is too dry or boring to fit with infographics, you’re still in the box. There’s always something cool to be discovered, created and shared—you just have to look, adjust and direct.
Your niche and products matter to some degree, but in many cases you don’t need your infographic to be about your business itself—you just need it to be of high interest to your audience.
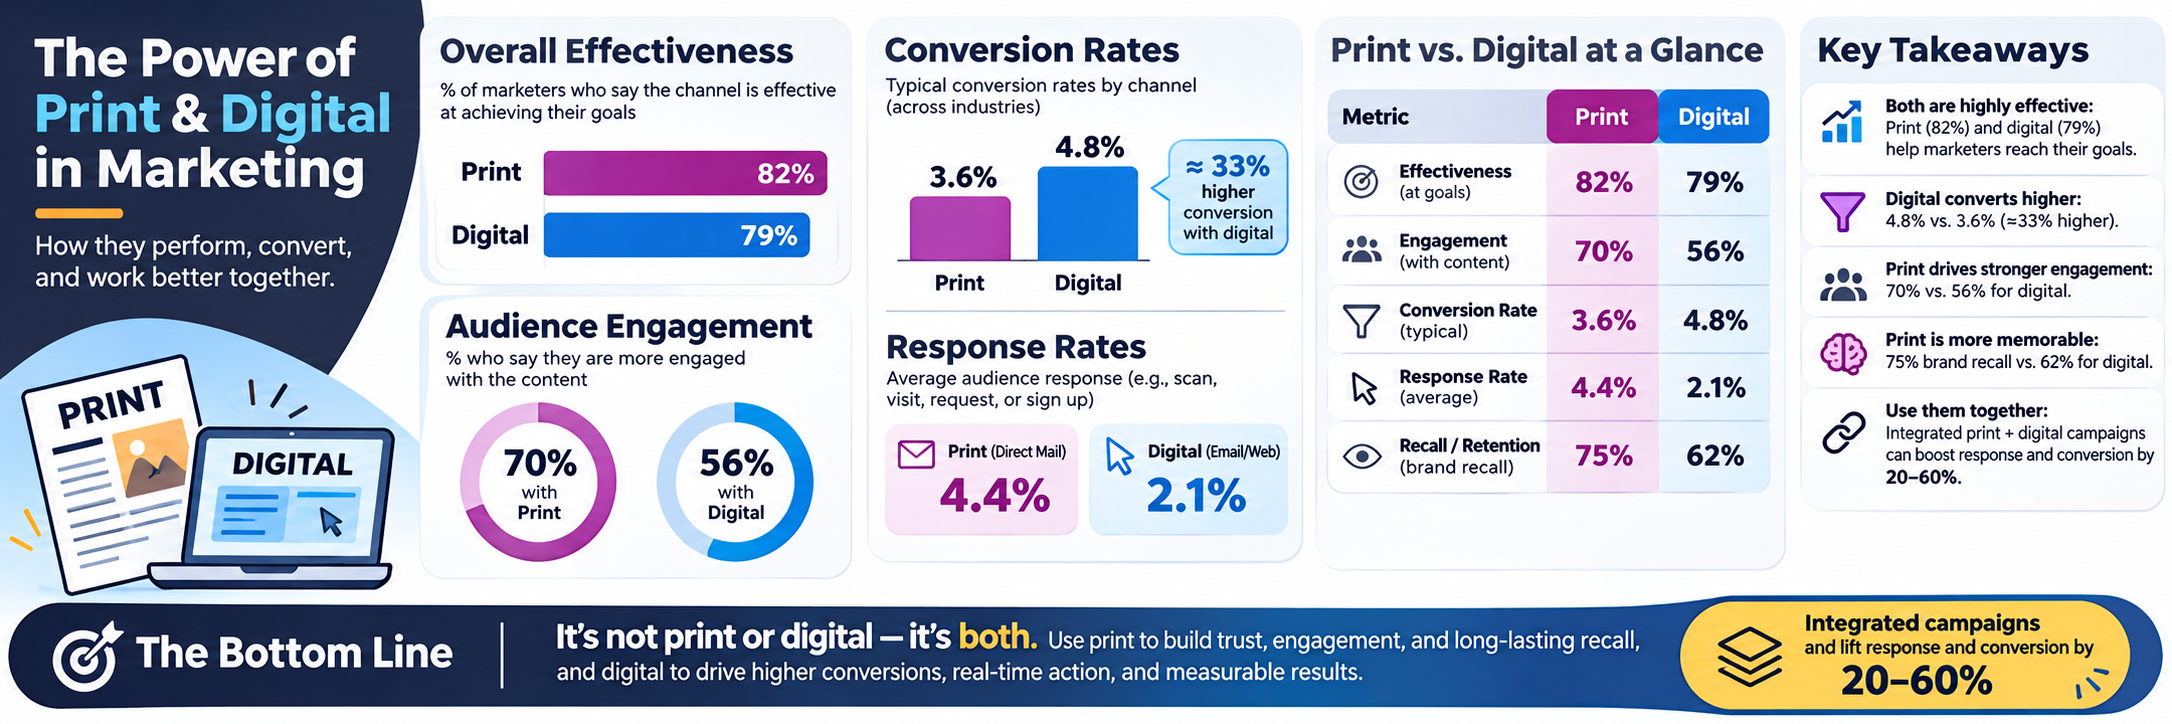
To know what your audience craves, you have to get into their heads. Building marketing personas goes a long way in helping you create content targeted to their interests.
Let’s say your company sells business phone systems. Who are your prospective buyers? Based on a marketing persona, you’ve found that they are business owners, chief communications officers and IT directors. Those people are interested in business development, economic growth and marketing strategies. They probably read magazines like Forbes and Financial Times and have studied subjects like economics or business.
You can adjust and direct those interests to create an infographic that shows statistics about business development and growth in general, but doesn’t mention your company specifically. The result is a useful, interesting infographic your audience can share across the board because it applies to their network and makes them look like an expert.
#2: Lock in a Killer Topic
With your audience’s basic traits in mind, you can use tools like BuzzSumo, Google search, Google News and Topsy to find topic ideas to inspire your overall concept. Type in your keywords (e.g., your audience’s interests or traits) to see the most shared articles across the web related to those terms—the last six months should be plenty.
When you find some relevant topics, click over to the sites and snoop around—fill your mind with ideas and let them slowly shape themselves into different infographic theme concepts.
Brainstorm different themes and narrow them down to one or two. You’ll be able to see which one fits best as you organize your data (discussed below). When you have a strong theme, it’s much easier to choose which data to keep and which data to ditch.
#3: Find and Organize the Best Data
As with the conceptual stage, you’ll have to hit the virtual pavement and research your topic thoroughly. Look for data and statistics that support your topic, but aren’t readily available to everyone. Search for PDFs, PowerPoint presentations and other data sources.
Using specific search operators in Google can yield excellent results. Here are a few I’ve tried:
site:slideshare.net startups statistics
filetype:pdf startups statistics
startups intitle:statistics
Filter the results by date and database (e.g., images, news, videos) to find data that may be hiding in less-traveled corners of the web.
Once you’ve completed your research and have a ton of useful information, start organizing the data.
Many marketers try to include every statistic they find and often end up with an infographic that is text-heavy and overwhelming. Keep in mind that people are busy and mostly just scan content. Readability will make or break your infographic.
Avoid information overload by evaluating your data objectively. Is it integral to your story? If you’re not sure, take it out.
#4: Share a Clear Creative Work Order
When you’ve decided on the final theme and direction, write up a clear creative work order that specifies the visual theme (include examples if necessary).
My creative work orders include color codes to show what should be text and what should be visual. You or the your designer can tell at a glance how to convey specific information.
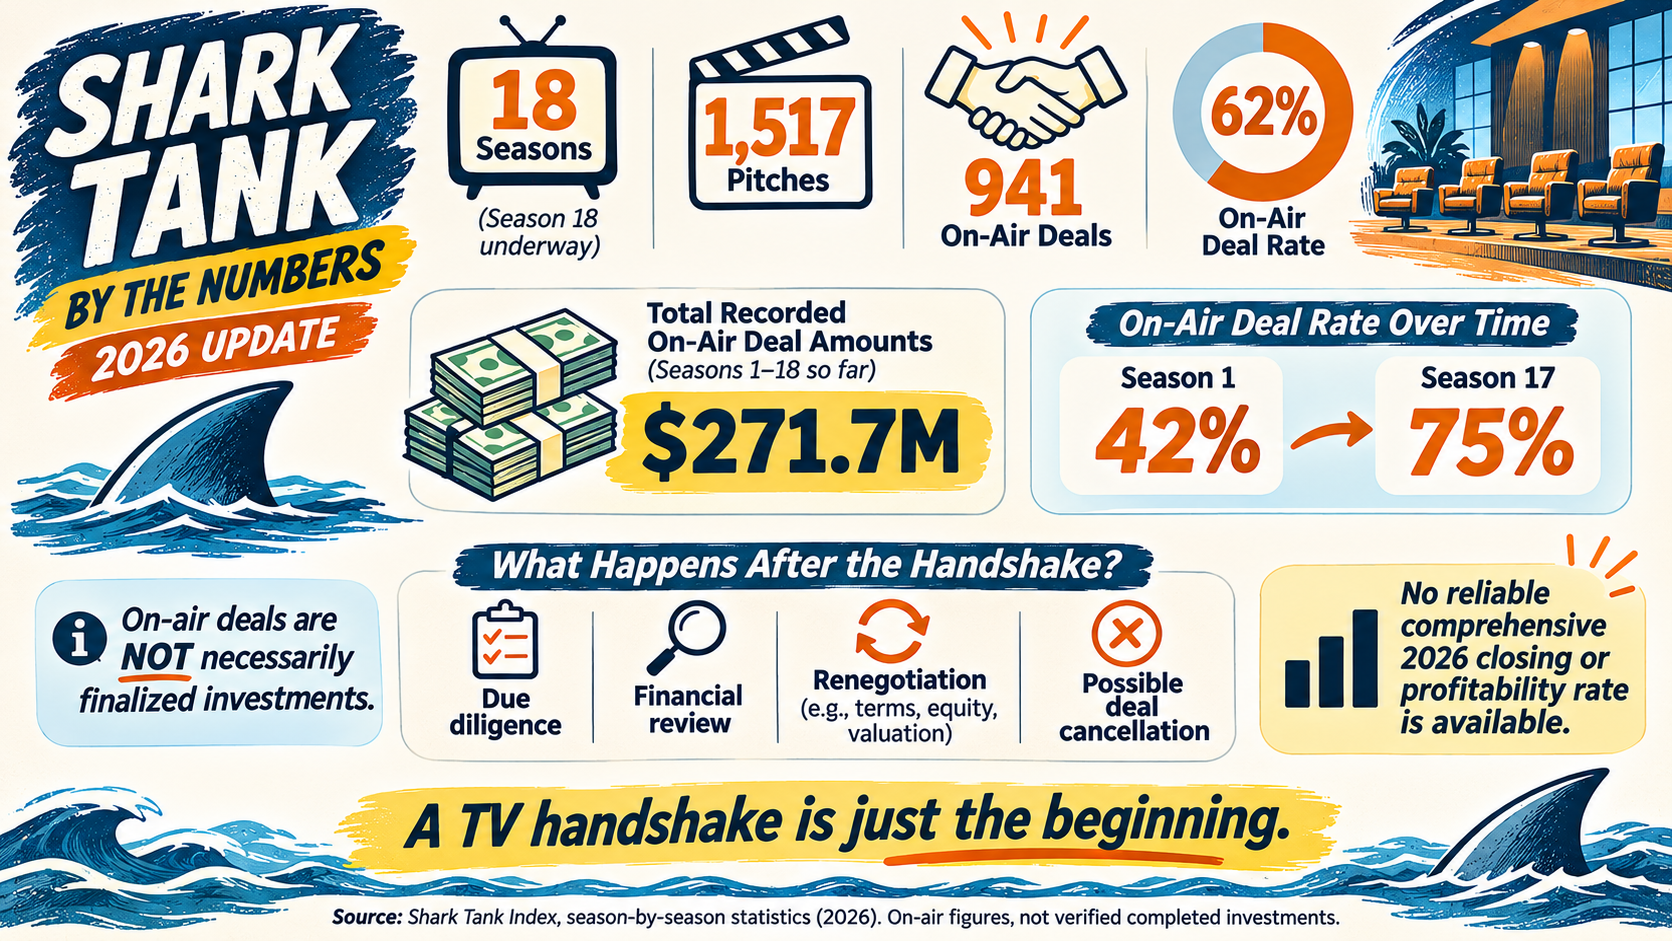
The example below is a partial color-coded work order I made for an infographic related to the growth of startups and new businesses. I provided data and asked for it to be presented in a theme based on the TV show Shark Tank. I chose the theme because the premise of Shark Tank is that hopeful entrepreneurs sink or swim, and startups face similar challenges.
Intro Section:
For 2026. The biggest change is that the Sharks now make on-air deals on roughly 62% of pitches, according to a third-party episode database.
Metric Updated 2026 figure
Seasons 18th season underway
Pitches recorded 1,517
On-air deals recorded 941
On-air deal rate 62%
Total recorded deal amounts $271.7 million
These figures are from Shark Tank Index and include the episodes it has recorded for Season 18. They represent deals announced on television, not verified completed investments.
Shark Tank Index+1
I'll retain the navy, orange, yellow, and cream palette, with more white space and an emphasis on the difference between televised deals and investments that actually close.
2026 infographic updated. The new version also removes the outdated claim that only 1 in 17 ventures becomes profitable, because I couldn't verify a comparable current statistic.
Source: Shark Tank Index — 2026 Statistics.
Using those clear instructions, I produced this:
You (or your designer) can make a thumbnail of the infographic and share you the final Illustrator file. You’ll need both when you start the promotion phase.
And Cite your Sources even if it’s Ai!
Whether you’re writing an article, a blog post or creating an infographic, it’s important to cite your sources—both to give credit to the original articles and to lend additional credibility to your own content.
If you list statistics without explaining where you found the data, people may doubt the veracity of your content. Make sure you list all of your sources at the bottom of the infographic so people can read more about the content and statistics you’re sharing.
As an added benefit, you can let your sources know that you’ve included their content in your infographic. Who knows, they just might choose to share it on their site or so
#5: Publish and Promote the Infographic
At the beginning of this article I said people research, create, embed and hope. This is where you replace hope with promote to ensure your infographic is picked up and shared by others.
Below I’ll share how you can use social media and blogger outreach to get the word out. You’ll also discover how simply repackaging your content can generate different types of links.
Write Supporting Articles
The journey to discovery has to start somewhere and the most likely place is your own website.
Write companion articles to support your infographic and publish them (and the infographic) on your site along with the embed code. When others find your infographic, they can grab the embed code and share it on their own sites.
Your articles should cover specific aspects of the infographic in greater depth. The key here is to avoid regurgitating what’s on the infographic. Write something complementary and of value so people are more likely to share.
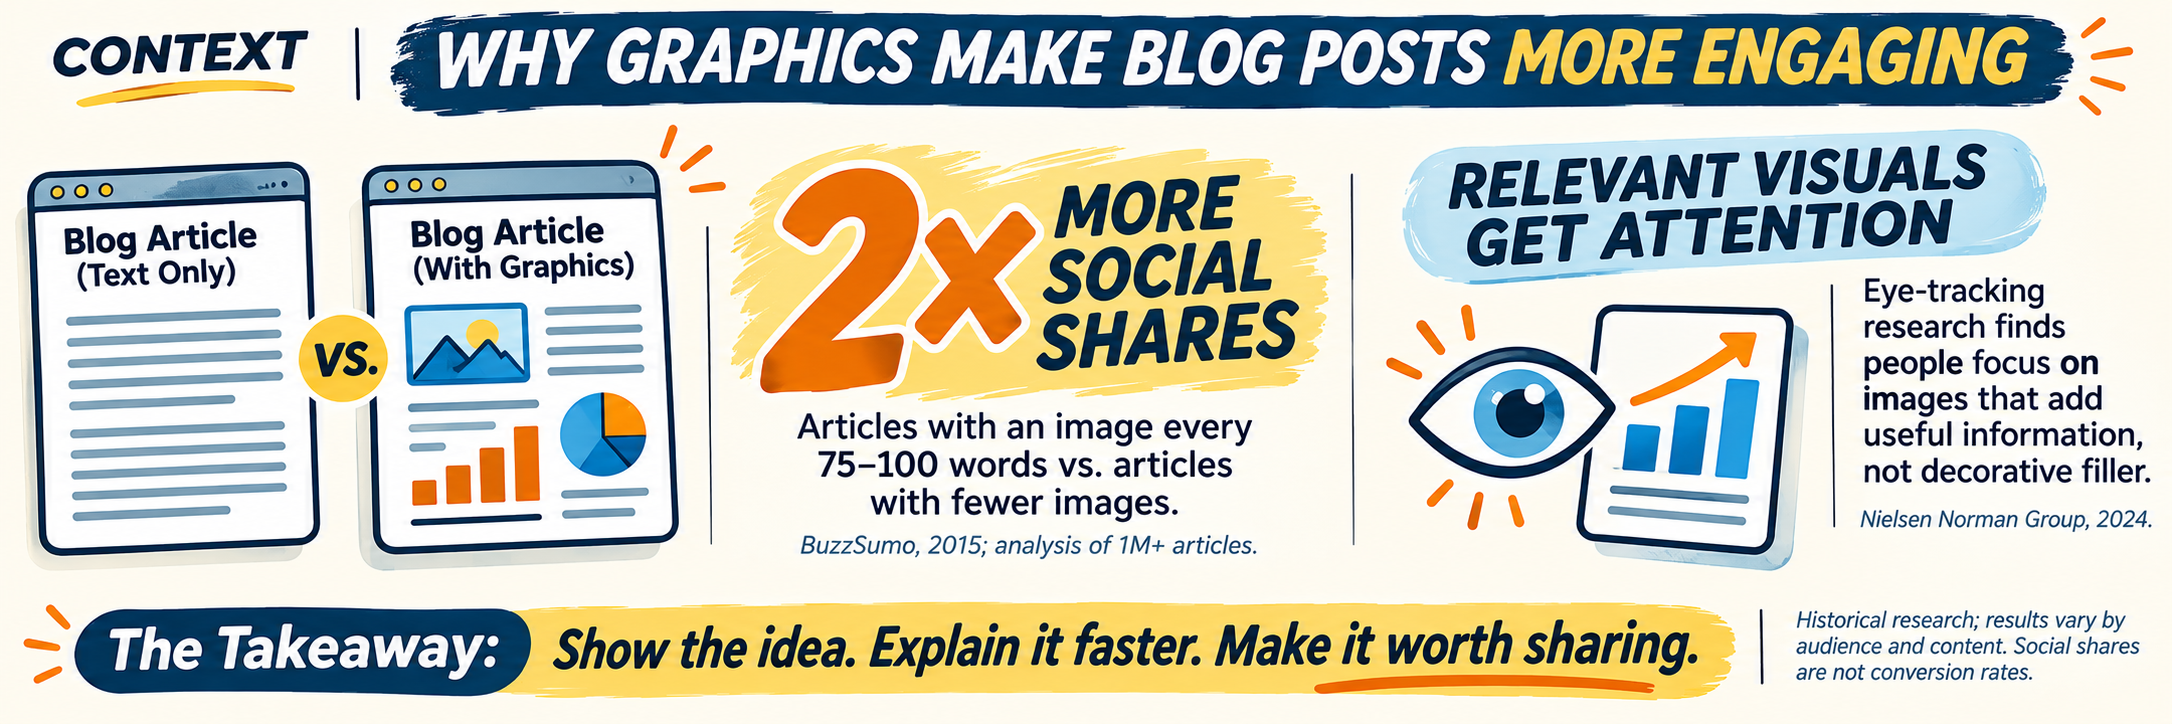
You can also find Google communities and sites dedicated to sharing infographics, such as Infographics Plus and Digital Information World. Another angle is to reach out to people who run infographic boards on Pinterest, as these can also generate tons of repins and site traffic.
Hypertarget Your Audience With Social Ads
Facebook is one of the most surefire ways to promote your branded infographic to your audience. With its advanced ad targeting, you can’t miss!
Using ads with the Clicks to Website objective, you can create dark posts with a snippet about your infographic that includes a thumbnail. Dark posts let you post as many ads as you’d like without them showing on your Facebook page.
X (Twitter) StumbleUpon, Reddit and Outbrain also have promotion options. Their effectiveness varies based on the topic of your infographic and where and how you advertise. On Reddit, for example, you have to find a relevant subreddit to advertise in to create a buzz.
On Outbrain and StumbleUpon, popular mainstream topics do well—BuzzFeed-style headlines capture a lot of interest.
Twitter can be more focused based on keywords and hashtags, but the traffic tends to be more expensive. If you have a large budget, use all of these methods. Otherwise, start with Facebook ads and work your way down the list.
Partner With Bloggers
Successful blogger outreach starts with a good pitch list. Find and reach out to people who have shared infographics about similar topics in the past, as they’re the most likely to share yours if you simply tell them about it.
An easy way to find compatible bloggers is to Google [your keyword] + infographic. Here are a few search operators you can try:
“keyword 1 keyword 2” + infographic
intitle:infographic + keyword 1 keyword 2
allinanchor:infographic + keyword 1 keyword 2
You may want to consider using Google’s date filter to find sites that have recently shared these infographics.
Reverse-Engineer Shares to Build Your Pitch List
To expand your pitch list, you can reverse-engineer shares on popular sites to find potential partners. Visual.ly and Google Images are perfect for this tactic.
Visual.ly isn’t just a great place to promote your own infographics, it’s also a great way to find them. Why would that matter? When you find infographics similar to yours, you can do a backlink search to find out who has shared them and ask if they’ll share yours as well.
For example, if you’re looking for infographics about how to use Google+, go to Google and search site:visual.ly + google plus.
Visit each of the pages in the results and look for the source URL. For example, this page on Visual.ly: http://visual.ly/how-increase-your-google-engagement-281 links to this page on Quicksprout: http://www.quicksprout.com/2014/02/14/how-to-increase-your-google-engagement-by-281/.
Go to ahrefs and paste the second link (Quicksprout) into the box to do a page-specific backlink search. The results will look something like this:
Visit each of the pages in the results and look for the source URL. For example, this page on Visual.ly: http://visual.ly/how-increase-your-google-engagement-281 links to this page on Quicksprout: http://www.quicksprout.com/2014/02/14/how-to-increase-your-google-engagement-by-281/.
Go to ahrefs and paste the second link (Quicksprout) into the box to do a page-specific backlink search. The results will look something like this:
Visit the infographic page, identify the source and copy the URL. Then head over to Google and paste the image URL into the search box and filter by Images.
Visit the infographic page, identify the source and copy the URL. Then head over to Google and paste the image URL into the search box and filter by Images.
Presentations are easy enough to make. Take your most important points, grab your illustrations and drop them into PowerPoint. Then upload your presentation to SlideShare.net and other sites that accept presentations.
Finally, take your presentation, expand upon it with text from your research, add a few illustrations from your infographic and voilà! You have an ebook you can use as newsletter or email linkbait.
#7: Measure and Track
To gauge whether your infographic marketing is effective, it’s important to track key performance indicators (KPIs). Some of the most popular KPIs are basic social interactions (retweets, +1s, likes), links and traffic back to your infographic article, Google organic rankings and mentions.
You have several tools at your disposal to track social engagement. ShareTally tells you how many times a page has been shared socially; Tailwind app keeps track of how many times your infographic has been repinned on Pinterest; and TrueSocialMetrics can show you who engaged with your content, as well as other general statistics.
Other tools include Mention.com, which tracks mentions of your infographic. Moz tracks domain authority, links built, ranking changes, etc. You can find a lot of data within the Google Analytics Social tab, and Data Hub Activity shows you who has shared your content socially.
Regardless of which KPIs or tools you use, the key is to track the data consistently to determine if your infographic marketing investment is paying off.
Infographics are a must in every marketing arsenal—audiences are drawn to visual content much more than lengthy text.
A little preparation on your side (like research and organization), along with a detailed work order for the designer result in a more streamlined process and a superior end product, which in turn impacts your site’s visibility and overall engagement.
What do you think? Have you used infographic marketing? If so, what is your creative process? Do you have other ideas for promotion?